Tech Leads While Materials Lag, All Indices Positive as the Fed Cuts Rates Again
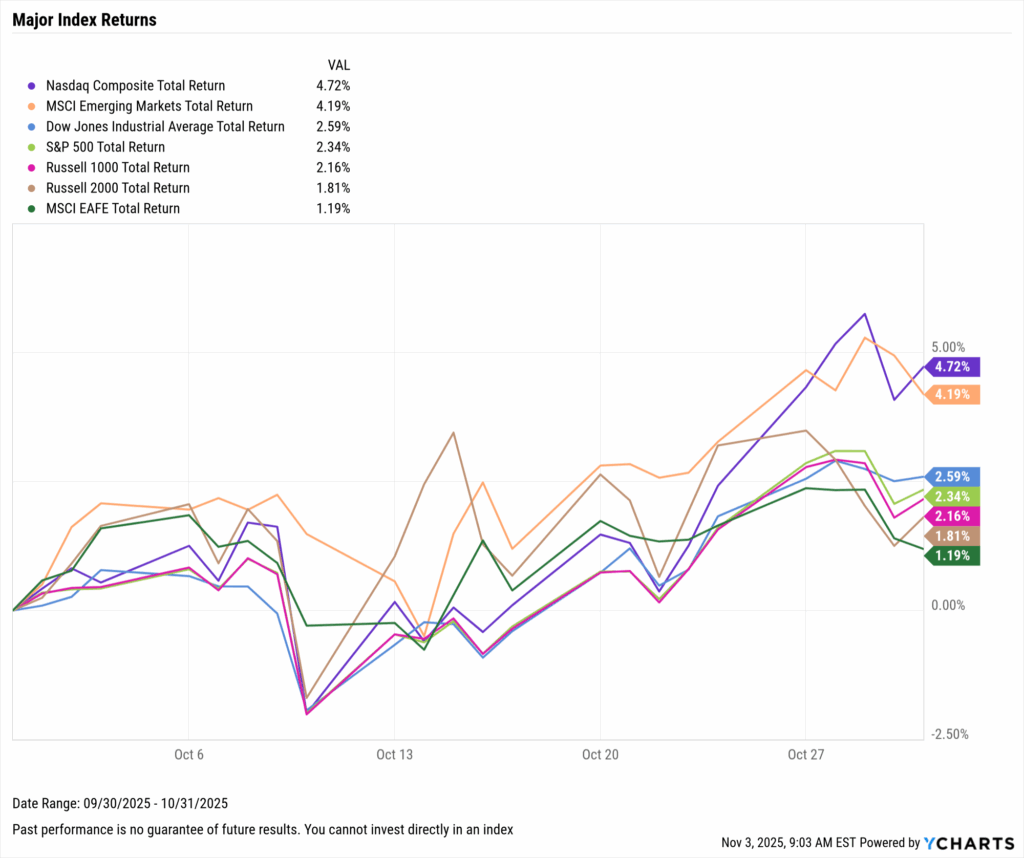
Markets moved higher across the board for the second straight month, as the S&P 500 posted a gain of 2.3%. This advance was led by the Nasdaq and emerging markets, which increased by 4.7% and 4.2% respectively. October’s broad-based gains reflect continued investor confidence, as the Fed cut interest rates by 25 basis points for the second consecutive month.
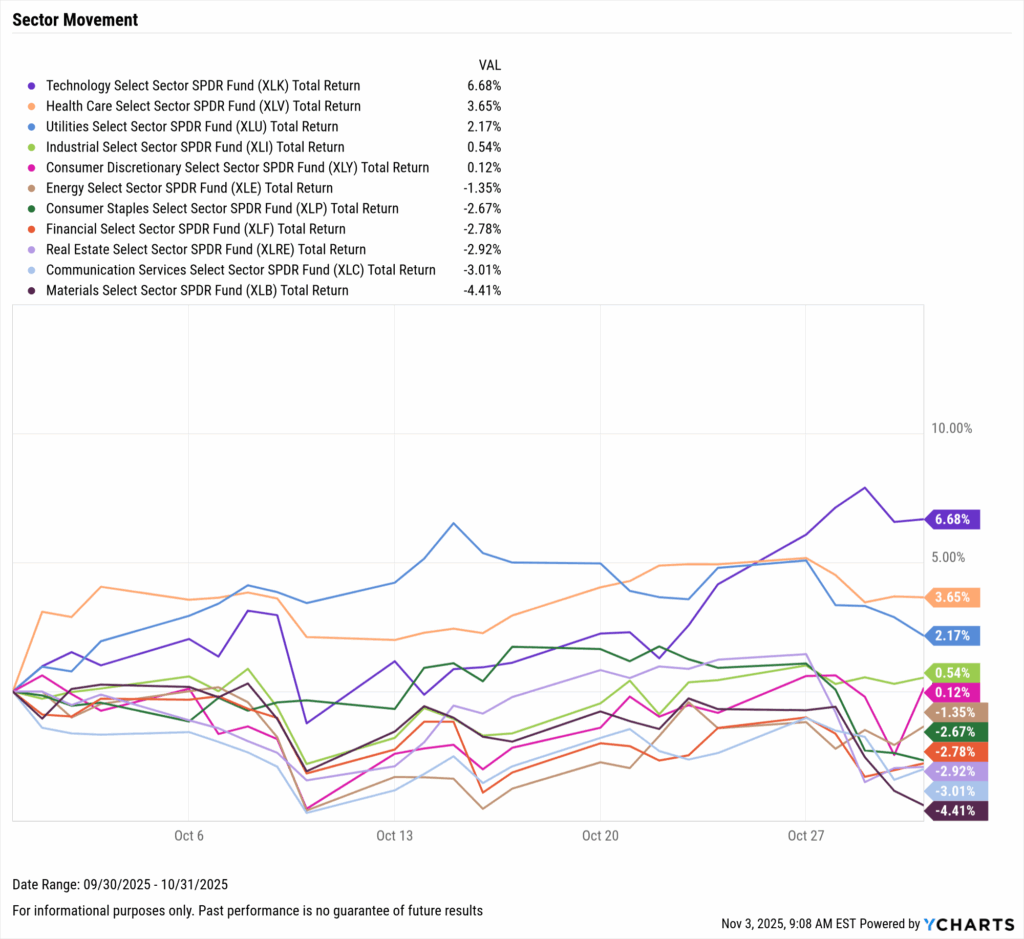
Sector performance was split in October as Technology led the way with another near-7% month. Communication, Real Estate, and Financials were all negative, though none worse than Materials, which slipped 4.4% for the month.
The ongoing government shutdown delayed several key economic releases, limiting visibility into the broader economy. With labor and select inflation reports postponed, the Fed Funds Rate 25 basis point rate cut to a target range of 3.75%–4.00% remains the most significant policy development.
Nvidia Overtakes Entire Nations
Nvidia (NVDA) has officially entered uncharted territory. The company’s market capitalization has surged past $5 trillion, making it larger than the entire GDP of every country globally except the United States and China. At this scale, Nvidia alone is worth more than two Canadas and rivals the combined economies of Italy and France.
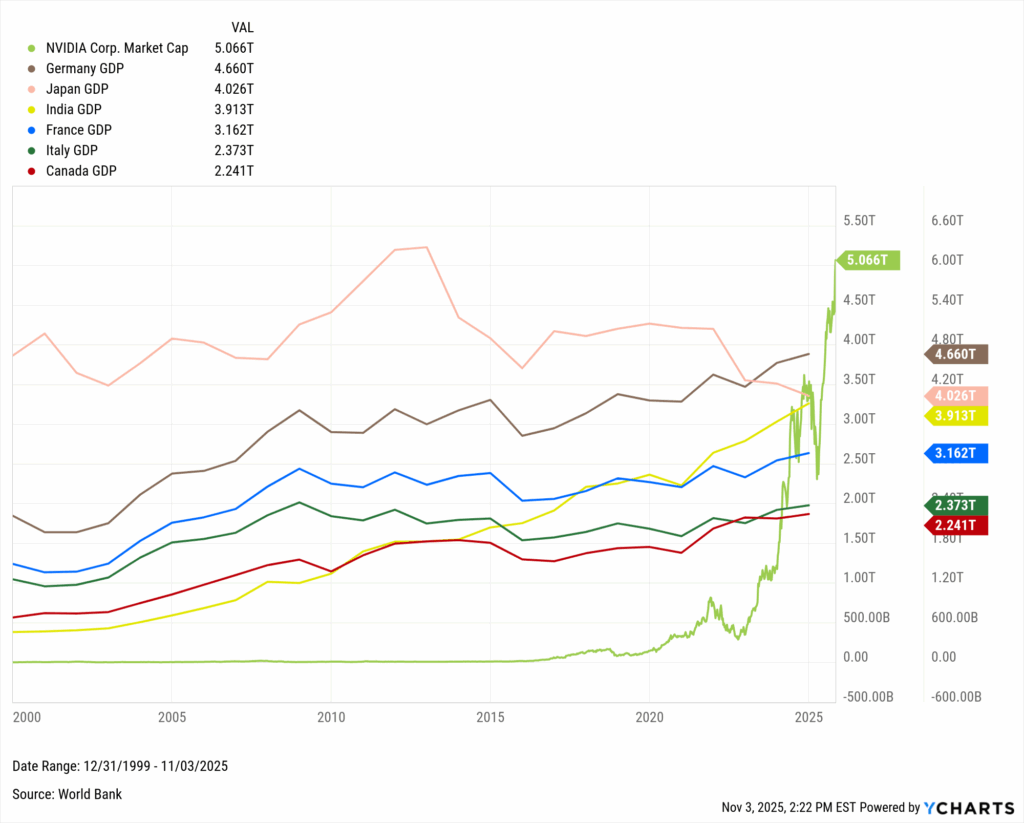
Its rise, up 28,900% over the past decade, has reshaped modern markets. Nvidia now accounts for 8.5% of the entire S&P 500 Index, an extraordinary level of concentration for a single stock. Once a leading indicator of innovation, the company has become a measure of market sentiment itself, driving major index performance and portfolio returns alike.
With earnings set for November 19th, the stock currently trades at a P/E ratio of 59, leaving investors eager to see whether results can sustain a valuation rivaling that of entire nations. The comparison highlights both the power and potential imbalance of today’s equity landscape, one that advisors can explore, visualize, and contextualize directly in YCharts.
Technology Pushes Higher While Materials Lag, All Major Indices Positive in October
Major Indices
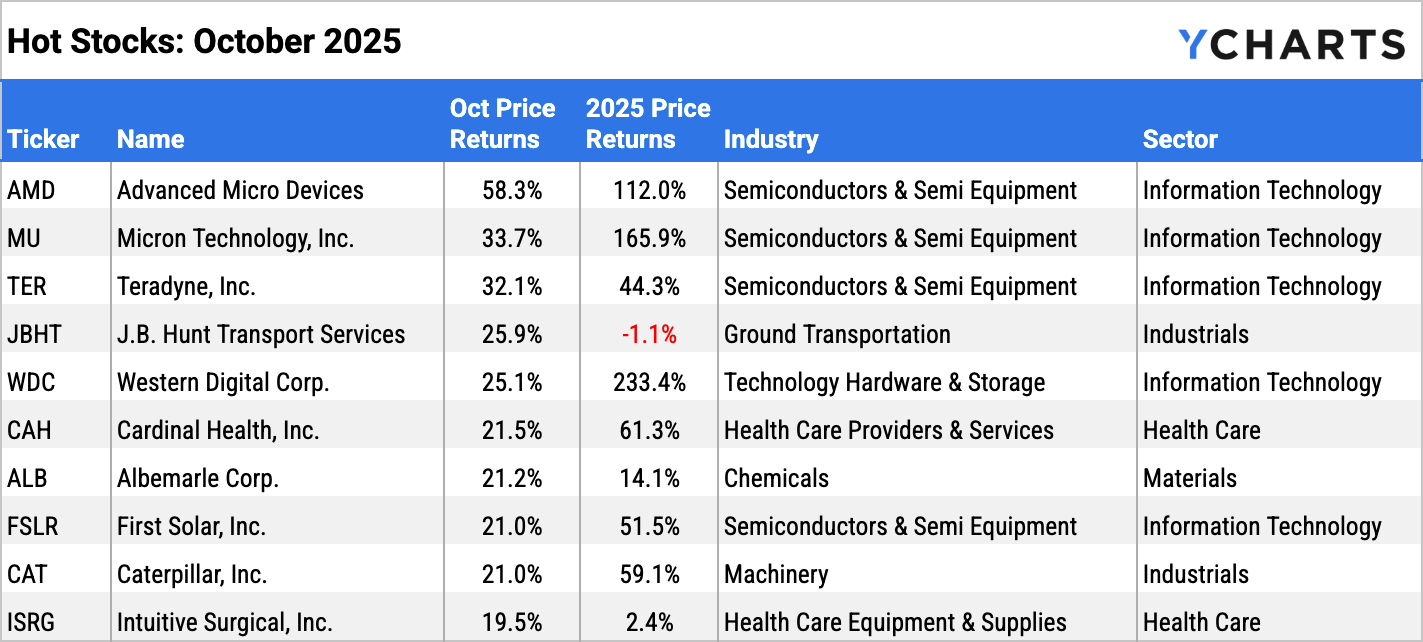
Hot Stocks: Top 10 S&P 500 Performers of October 2025
| Symbol | Name | 1 Month Price Returns | YTD Price Returns | Industry | Sector |
|---|---|---|---|---|---|
| AMD | Advanced Micro Devices, Inc. | 58.3% | 112.0% | Semiconductors & Semiconductor Equipment | Information Technology |
| MU | Micron Technology, Inc. | 33.7% | 165.9% | Semiconductors & Semiconductor Equipment | Information Technology |
| TER | Teradyne, Inc. | 32.1% | 44.3% | Semiconductors & Semiconductor Equipment | Information Technology |
| JBHT | J.B. Hunt Transport Services, Inc. | 25.9% | -1.1% | Ground Transportation | Industrials |
| WDC | Western Digital Corp. | 25.1% | 233.4% | Technology Hardware, Storage & Peripherals | Information Technology |
| CAH | Cardinal Health, Inc. | 21.5% | 61.3% | Health Care Providers & Services | Health Care |
| ALB | Albemarle Corp. | 21.2% | 14.1% | Chemicals | Materials |
| FSLR | First Solar, Inc. | 21.0% | 51.5% | Semiconductors & Semiconductor Equipment | Information Technology |
| CAT | Caterpillar, Inc. | 21.0% | 59.1% | Machinery | Industrials |
| ISRG | Intuitive Surgical, Inc. | 19.5% | 2.4% | Health Care Equipment & Supplies | Health Care |
Laggards & Losers: 10 Worst S&P 500 Performers of October 2025
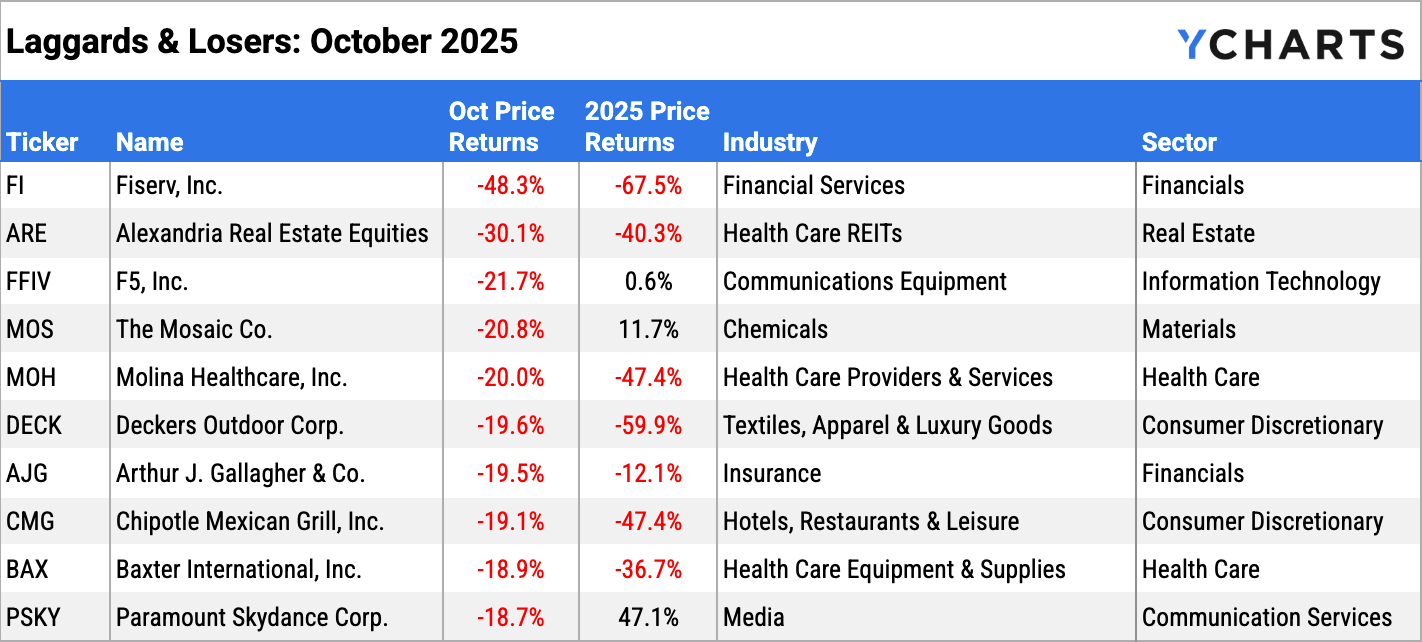
| Symbol | Name | 1 Month Price Returns | YTD Price Returns | Industry | Sector |
|---|---|---|---|---|---|
| FI | Fiserv, Inc. | -48.3% | -67.5% | Financial Services | Financials |
| ARE | Alexandria Real Estate Equities, Inc. | -30.1% | -40.3% | Health Care REITs | Real Estate |
| FFIV | F5, Inc. | -21.7% | 0.6% | Communications Equipment | Information Technology |
| MOS | The Mosaic Co. | -20.8% | 11.7% | Chemicals | Materials |
| MOH | Molina Healthcare, Inc. | -20.0% | -47.4% | Health Care Providers & Services | Health Care |
| DECK | Deckers Outdoor Corp. | -19.6% | -59.9% | Textiles, Apparel & Luxury Goods | Consumer Discretionary |
| AJG | Arthur J. Gallagher & Co. | -19.5% | -12.1% | Insurance | Financials |
| CMG | Chipotle Mexican Grill, Inc. | -19.1% | -47.4% | Hotels, Restaurants & Leisure | Consumer Discretionary |
| BAX | Baxter International, Inc. | -18.9% | -36.7% | Health Care Equipment & Supplies | Health Care |
| PSKY | Paramount Skydance Corp. | -18.7% | 47.1% | Media | Communication Services |
Employment
With September’s employment report delayed by the ongoing government shutdown, official labor data remains limited. The most recent release from August showed unemployment at 4.3%, reflecting a gradually cooling job market.
Advisors can continue tracking labor conditions in YCharts using alternative datasets that remain available throughout the shutdown. ADP Employment Change and ADP Private Employment provide monthly updates on private-sector payroll growth, while the Challenger Report highlights announced layoffs and sector-level shifts. For additional context, LinkedIn’s Jobs Report offers a broader view of hiring activity and workforce trends.
Consumers and Inflation
The US inflation rate rose to 3.01% in September, though core inflation fell to 3.02%. The US Consumer Price Index sits at 0.3% MoM, and US Personal Spending went unreported as a result of the government shutdown.
At the October 29th FOMC meeting, the Federal Reserve cut its key Fed Funds Rate target range by another 25 basis points to 3.75%-4.00%. Fed Chair Powell stated that “job creation is pretty close to zero”, and that a further rate cut in December is “not a foregone conclusion, far from it”. The FedWatch tool still assumes over a 68% chance of a third straight cut when the FOMC meets next on December 10th.
Production and Sales
The US ISM Manufacturing PMI increased 0.4 points in September to 49.1, its second monthly increase in a row. The Services PMI fell by 2.0 points to 50.0, sitting directly on the line between expansion and contraction. The YoY US Producer Price Index and US Retail and Food Services Sales both went unreleased due to the government shutdown.
Housing
Existing Home Sales increased by 1.5% MoM in September, and the Median Sales Price of Existing Homes fell for the third month in a row by 1.7%, with prices sitting at $415,200. Mortgage rates declined throughout October, with the 15-year Mortgage Rate at 5.41% and the 30-year at 6.17% to end the month.
While US New Single-Family Home Sales were unreported, the NAHB Housing Market Index can be used to measure homebuilder confidence, providing an early indication of construction sentiment and future building activity.
Commodities
The price of gold increased slightly this month by 1.8% following a record-setting September, leaving SPDR Gold Shares ETF (GLD) at $368.12 per share. Oil prices decreased, with Brent crude down 4.4% for the month to $65.52 per barrel. WTI was down by 1.7% to $62.13.
Cryptocurrencies
Major cryptocurrencies posted a difficult month, despite what has been a very strong first three quarters of 2025. Ethereum slipped by 9.8% in October, as Bitcoin fell by 5.3% to $108,240.80 per coin.
Fixed Income Performance: Insights into Bond ETFs and Treasury Yields
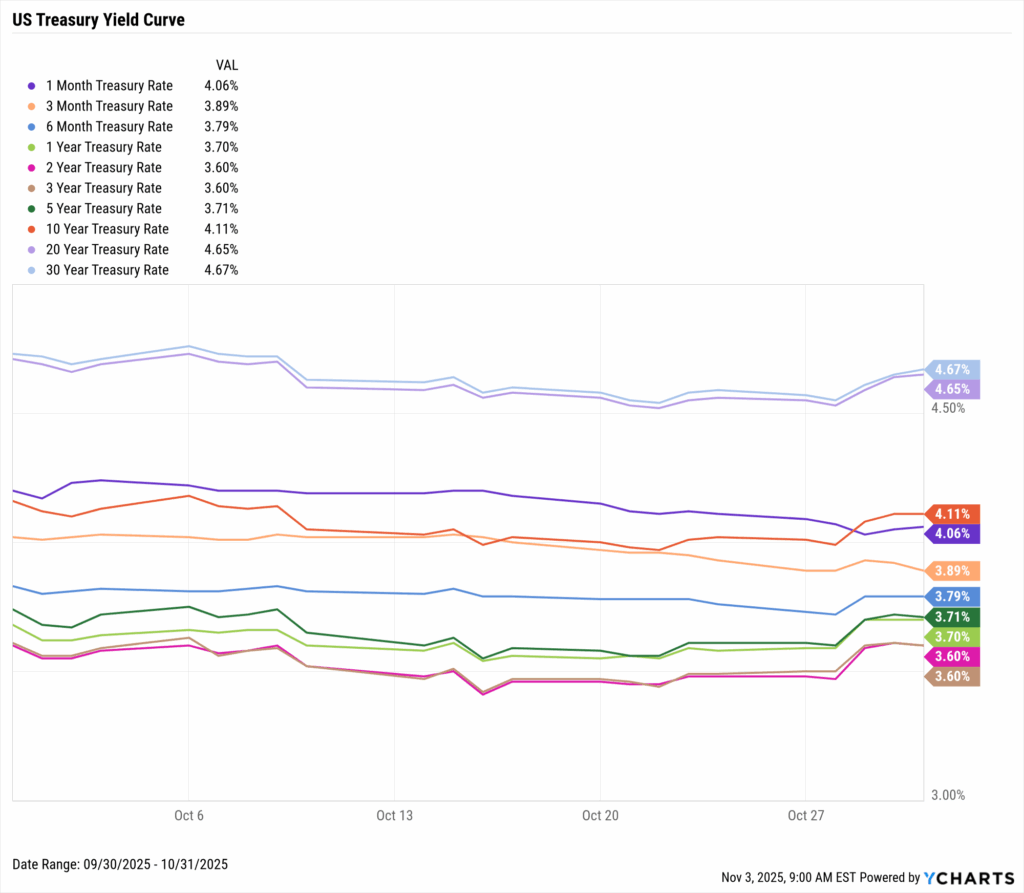
US Treasury Yield Curve
1 Month Treasury Rate: 4.06%
3 Month Treasury Rate: 3.89%
6 Month Treasury Rate: 3.79%
1 Year Treasury Rate: 3.70%
2 Year Treasury Rate: 3.60%
3 Year Treasury Rate: 3.60%
5 Year Treasury Rate: 3.71%
10 Year Treasury Rate: 4.11%
20 Year Treasury Rate: 4.65%
30 Year Treasury Rate: 4.67%
Bond Fund Performance
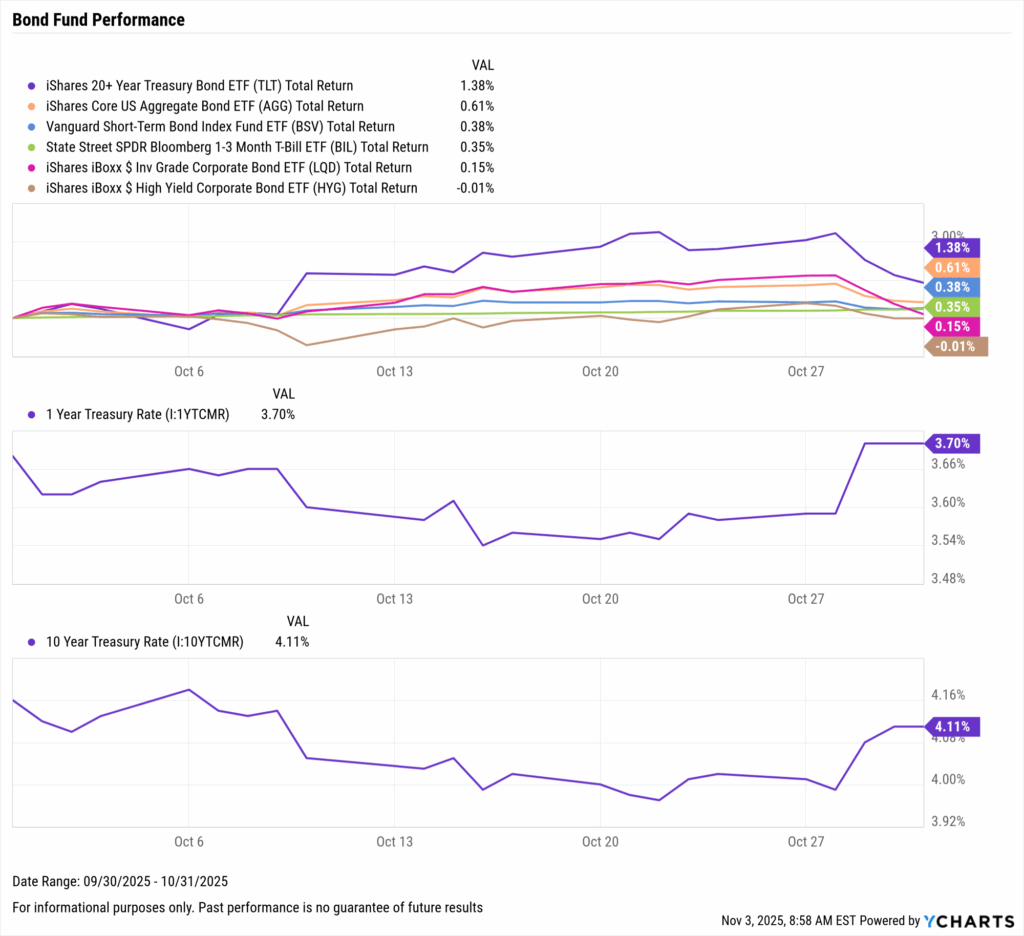
| Ticker | Name | 1 Month Total Returns | 3 Month Total Returns | 6 Month Total Returns | 1 Year Total Returns |
|---|---|---|---|---|---|
| TLT | iShares 20+ Year Treasury Bond ETF | 1.4% | 5.0% | 3.2% | 2.0% |
| AGG | iShares Core US Aggregate Bond ETF | 0.6% | 3.0% | 3.6% | 6.2% |
| BSV | Vanguard Short-Term Bond Index Fund ETF | 0.4% | 1.7% | 2.2% | 5.6% |
| BIL | State Street SPDR Bloomberg 1-3 Month T-Bill ETF | 0.4% | 1.1% | 2.1% | 4.3% |
| LQD | iShares iBoxx $ Inv Grade Corporate Bond ETF | 0.1% | 3.1% | 5.4% | 6.7% |
| HYG | iShares iBoxx $ High Yield Corporate Bond ETF | 0.0% | 2.0% | 5.8% | 8.2% |
As we inch closer to 2026, monitor the effects of continued rate cuts and alternative economic data during the ongoing government shutdown.
Why work with a financial professional?
People at every life stage, whether working, approaching retirement or already retired, seek financial guidance. While their specific concerns vary, from maximizing workplace benefits to managing debt or planning for long-term care, they share a common goal: greater confidence in their financial decisions.
Here are a few common topics that often come up this time of year:
- Year-end strategies: Are there charitable contributions or investment adjustments to consider before December 31?
- Account contributions: Have you reviewed your retirement or health savings accounts?
- Goal check-in: Small steps made now can support longer-term goals.
- Looking ahead: It’s never too early to consider what you’d like to prioritize in the upcoming year.
Everyone’s financial situation is unique, but you don’t have to figure it all out alone.
If any of this has been on your mind lately, contact an Adams Brown Wealth Consultant today.
Source(s):
YCharts Monthly Market Wrap: October 2025
This material was developed and produced in part by FMG Suite to provide information on a topic that may be of interest. FMG Suite is not affiliated with the named broker-dealer, state- or SEC-registered investment advisory firm.
Forecasts are based on assumptions and are subject to revisions over time. Financial, economic, political, and regulatory issues may cause the actual results to differ from the expectations expressed in the forecast.