Integrating Farm Management to Improve Your Profitability and Success
Xero and Figured: A Streamlined Solution
Successful farmers have consistent record keeping and dig into the numbers instead of simply preparing them for their yearly tax return. They understand the numbers and use them to make decisions for the future of their farm. These decisions go deeper than just a financial statement into the actual operations and the management of a farm.
Historically, most farmers have used a dual entry system – entering record keeping and farm management data into different systems. Every time you enter data in more than one place, you’re susceptible to errors, not to mention the countless hours that go into keeping double entry systems up-to-date and accurate.
Taking this into consideration, Adams Brown has adopted and helped develop an integrated farm management program that helps accurately and efficiently reconcile your books. Using both Xero and Figured together is a solution that provides a single-entry farm management software that enables you to use more useful data to make decisions.
Streamlining Your Accounting with Xero
Xero is an accounting software that connects with Figured, a farm management software that will be discussed below. This program is a standard set of accounts that helps streamline the bookkeeping process across the board for all agriculture clients.
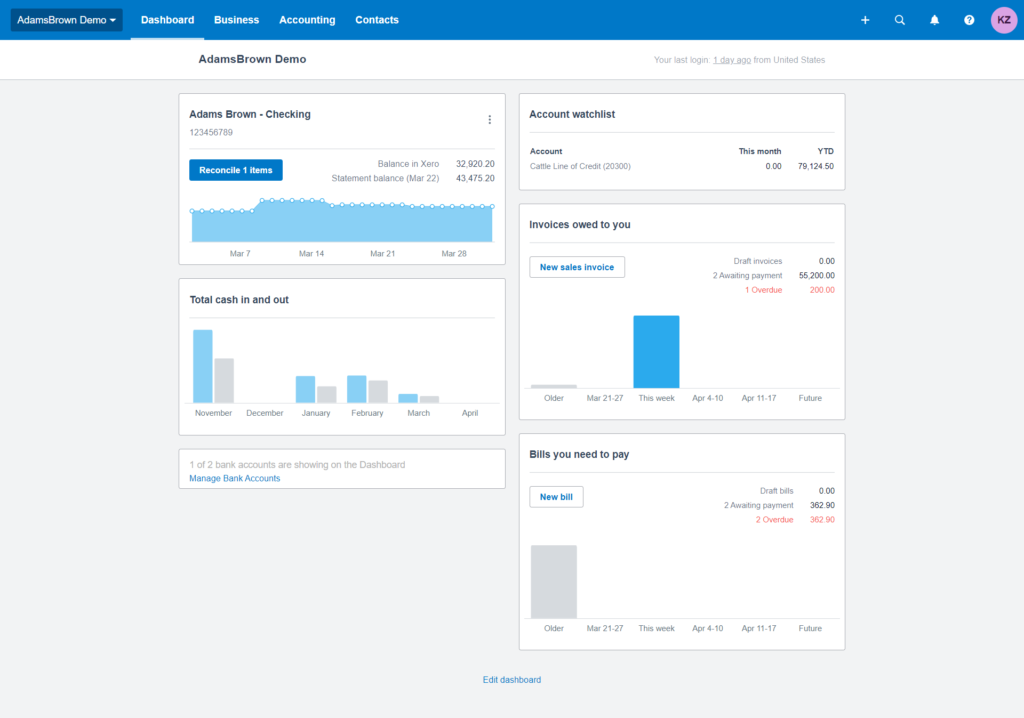
Shown above is the dashboard you will see once you log in. This dashboard makes it easy to access any pages you would need within Xero, as well as create an invoice or a bill for your account. This dashboard is completely customizable, and you can add all your farm accounts to the main screen, including:
- Checking accounts
- Savings accounts
- Loans
- Credit cards
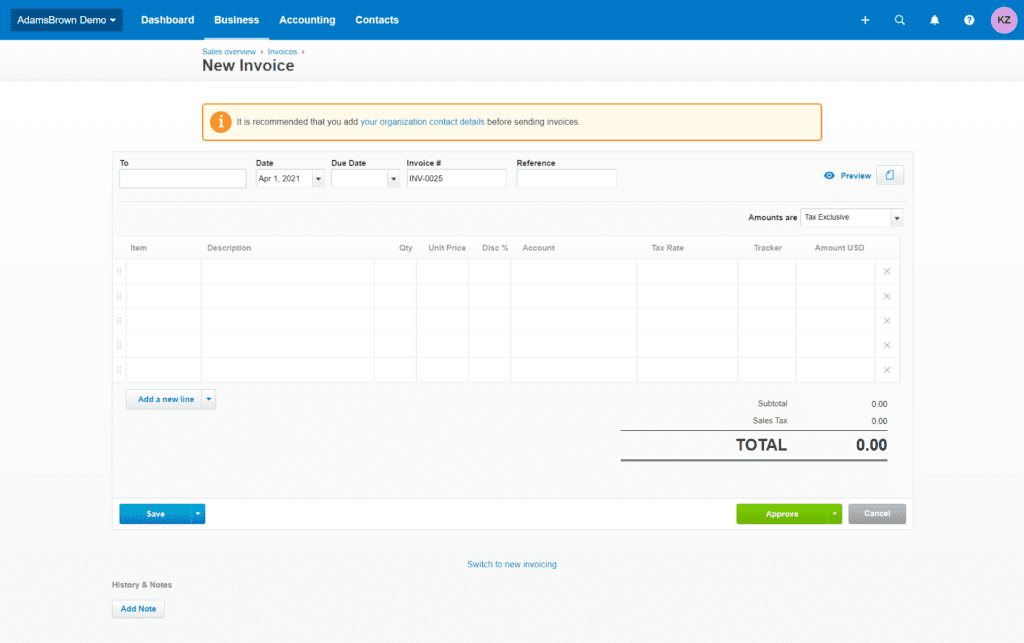
Both the invoice creation page, shown above, and the bill creation pages look very similar, and the documents are fully customizable. You can add your logo or attach related files and enter all relevant information.
In this program, you can also access your checking accounts and view an account transaction screen, shown below, where you’ll see your check register, and automatically see what’s been reconciled and what’s outstanding. It’s very easy to add new received money or spent money entries, and you can enter your check numbers or print checks directly from Xero.
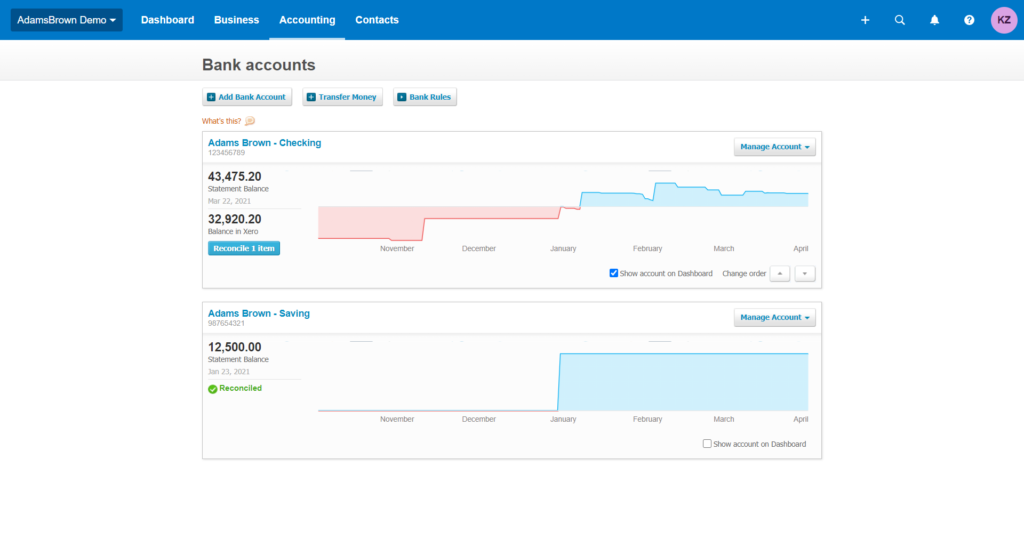
There is a bank statement tab that shows everything coming through automatically from your bank account. Through the spend money feature, you can see what has been reconciled and what hasn’t been inputted. A reconciliation tab shows the numbers coming through from your bank accounts, which are easy to connect or update through CSV files. This function shows outstanding charges that haven’t been reconciled, as well as showing charges that have a matched entry in Xero shown in green for you to quickly approve. This program will also generate a reconciliation report for you to download or print whenever you need.
Under the reports tab, there are various standard reports that can be run in Xero, including but not limited to:
- Balance Sheets
- Journal Reports
- Custom Reports
Any number shown in blue is hyperlinked in Xero, which means if you click the number it will take you to another page in the program to explain the entries further.
Transform your Farm Management Data with Figured
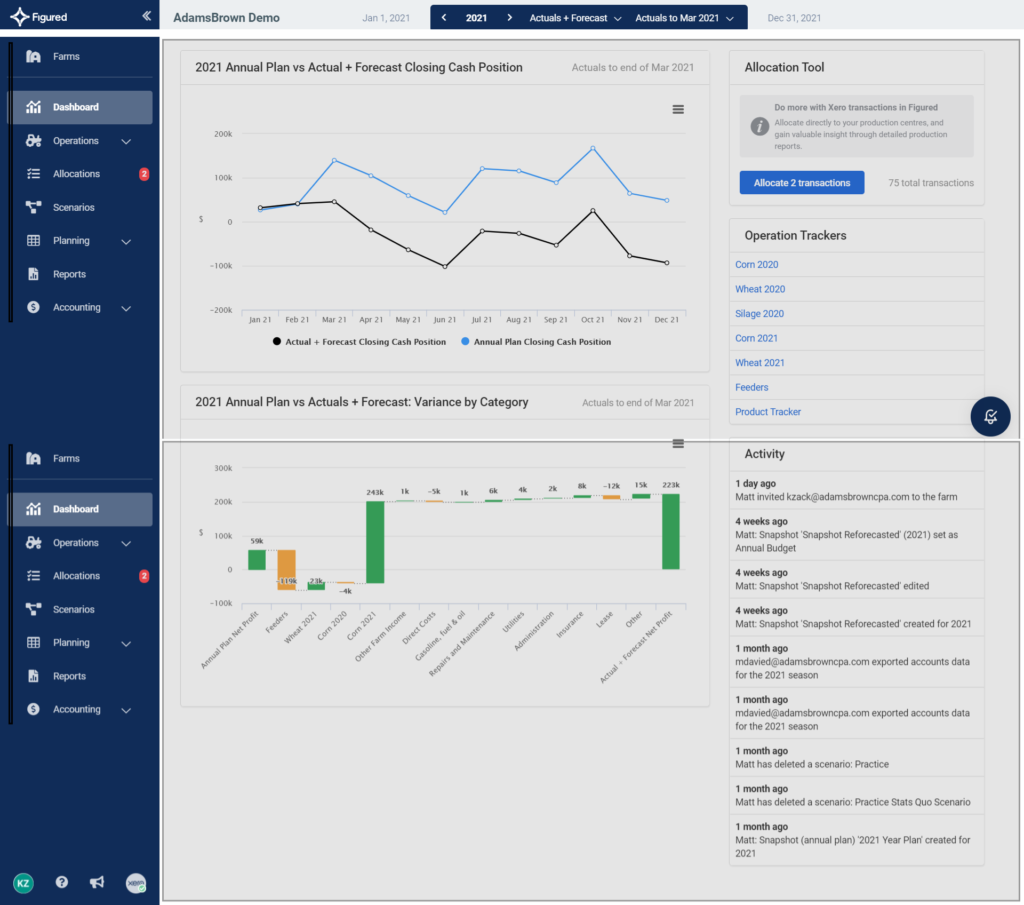
When you first log into Figured, you will be brought to a dashboard, shown below. There is a bar at the top that will show the global date setting which allows you to set a custom date, see the actual numbers, or see the actual numbers reported and forecasted numbers.
The Trackers tab is what drives the program, showing any crop or livestock on your farm. The first thing you will see when clicking into a specific crop or livestock is your Tracker Profit, shown below, which runs a variance report against your annual plan compared to your actual numbers to see how much you are deviating from your annual plan.
![]()
The Production tab, shown below, within the Trackers tab shows a breakdown of how much crop you’ve produced. There is also a tab under the Trackers tab titled Breakeven, where you can see the market price, estimated price, and the price you would have to charge to breakeven on the crop or livestock. The pencil icon next to the market price helps you look up any location you want and update the market price as often as you would like.
![]()
Under Trackers, there is also the ability to:
- Tag your fields for specific crops
- Harvest information
- Cost and other incomes.
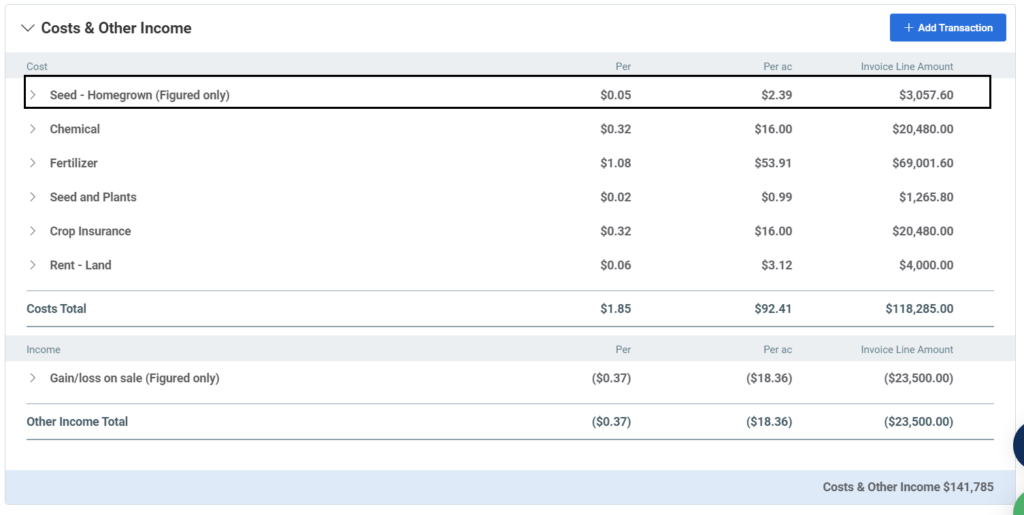
Cost and other incomes, shown below is where you will allocate expenses to the tracker. Using this function, you can see forecasted expenses you can expect to see coming up in the near months, as well as actual costs which have flown through Xero. This tab is ever-changing as the year progresses.
Just like in Xero, you can create transactions in Figured. You will fill out the same information and have the ability to attach a picture of a receipt or invoice with the purchase, and the attachments will flow over to Xero as well. Figured will automatically break out your fields and allocate them accordingly. Saving this transaction in Figured will push the information to Xero, creating a more streamlined data entry process.
If you create transactions in Xero instead of Figured, they will show up in the Allocations tab in Figured. In this tab, you can choose a crop to allocate purchases to. These allocations, once completed in Figured, will show up in the Costs and Other Incomes tab.
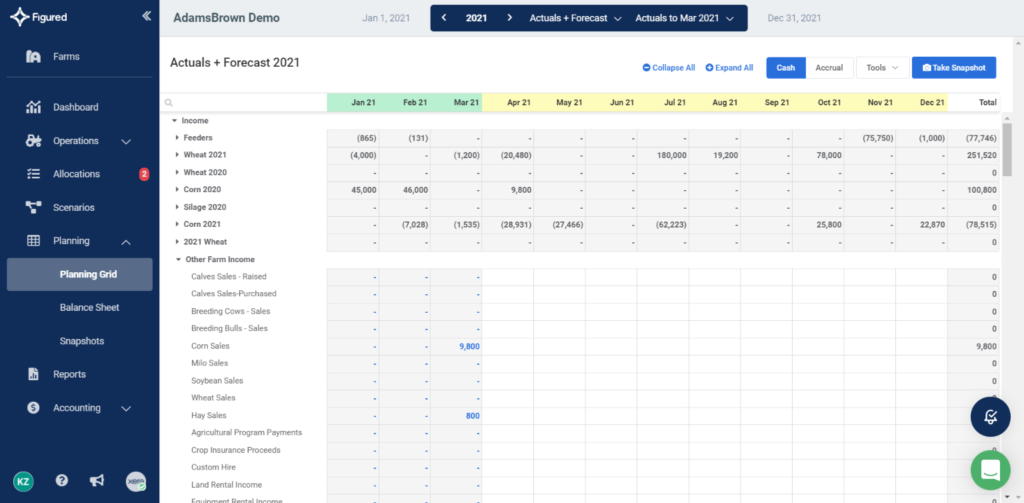
Inside the planning grid, shown below, you can create an annual plan for your farm. The numbers from the tracker tab will flow through to your planning grid, and you can enter projected farm income and operating expenses to plan throughout your year. Items that have come through Xero will show up in this planning grid as blue, so you can click on the number and be taken to the transaction reports for each account.
Once you get your year planned out, you can take a snapshot of your annual plan which will take a photo of these numbers and you can upload it as your annual plan. You have the ability to run reports using the snapshot saved from Figured as well.
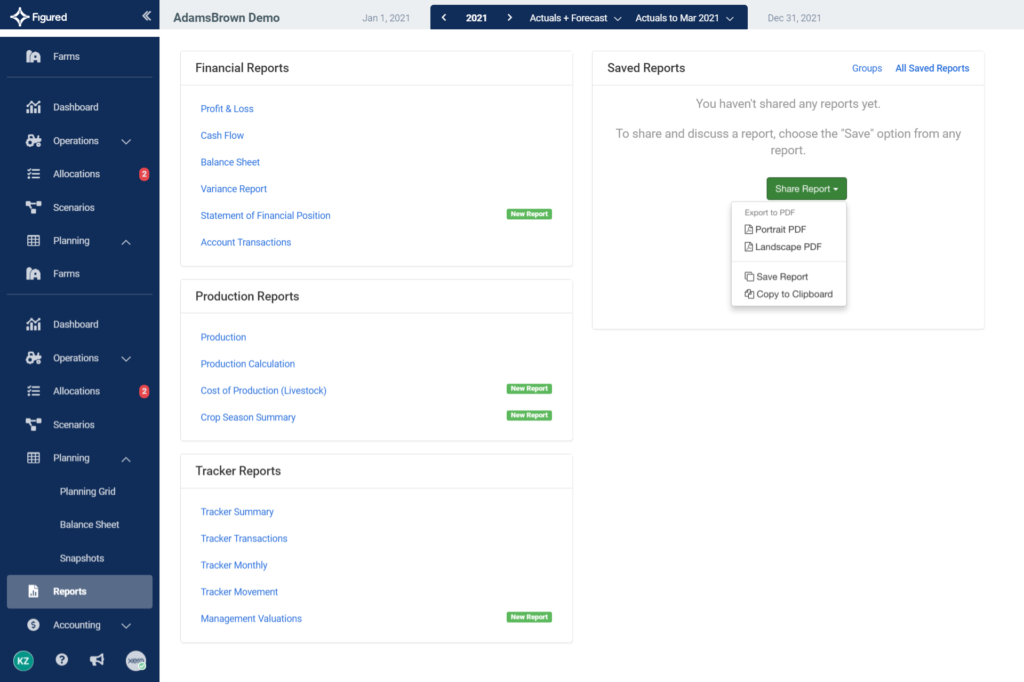
Under the Reports tab, shown below, there are several reports that can be run from Figured, including but not limited to:
- Profit and Loss
- Cash Flow
- Production
- Costs of Production
- Livestock Reports
- Crop Season Summary
To learn more about leveraging your data to make business decisions for your farm, contact Adams Brown.